2.1 Theoretical - Data Visualization
#ggplot #aesthetics #geoms #scales #facets #transformations #coordinatesystems
For the following plot, name the aesthetics (that is, name the mapping of variables to aesthetics), geoms, and scales. If applicable, name any facets, transformations, or special coordinate systems.
==height and age are discrete or continuous variables?
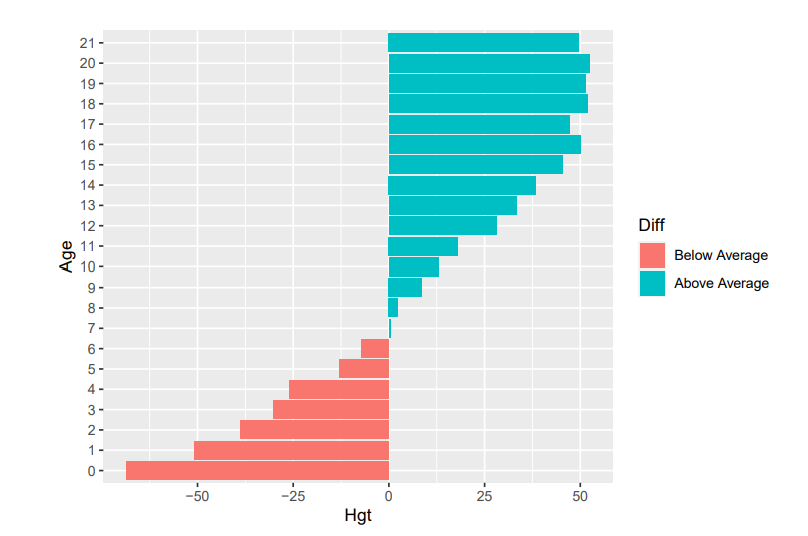
# This is a diverging bar chart. Aesthetics:
#  Hgt (maybe it's height) mapped to x-position
#  Age mapped to y-position
# Geoms: bars
# Scales:
#   x-axis: continuous (or linear?)
#   y-axis: technically it can be continuous, but in measurement people take it as discrete.
# Fill: below average and above average
# Facets: None(是否按照某个变量分成多个小图)
# Statistical transformations: None
# Special coordinate system: None
==Does this type of linear graph means continuous variables?
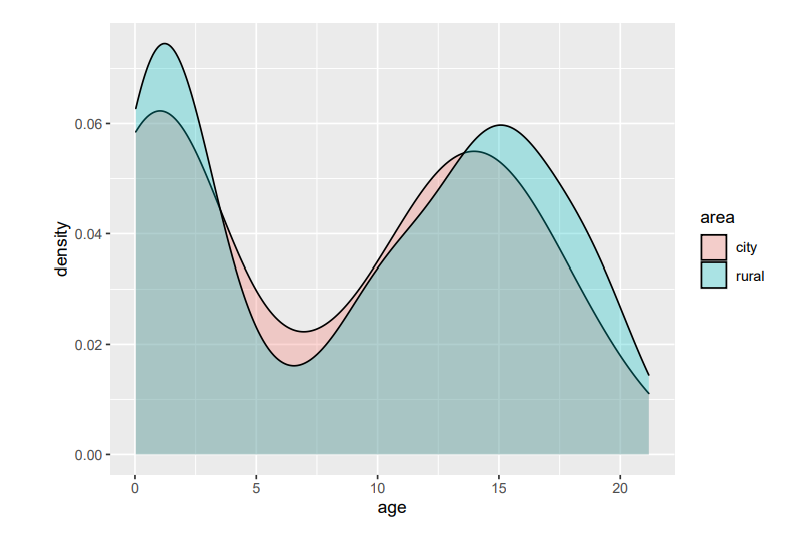
# This is a density chart. Aesthetics:
#  Age mapped to x-position
#  Density mapped to y-position
# Geoms: density lines
**Geoms**:

1. **Area**: The filled area under the curves represents the density distribution for each category.
2. **Line**: Curves or lines representing the density distribution for 'city' and 'rural'.
# Scales:
#   x-axis: continuous (linear graph are continuous ones)
#   y-axis: continuous.
# Fill: two types of areas in two levels, namely city (pink) and rural (teal).
# Facets: None
# Statistical transformations: None
# Special coordinate system: None
aesthetics: xxx mapped to x-position, yyy mapped to y-position
(Examples of aesthetics are:
x
y
alpha (transparency)
colour
fill
group
shape
size
stroke)
geoms: (point, line...)
scales: x-axis continuous/discrete, y-axis continuous/discrete
参考week 2问题
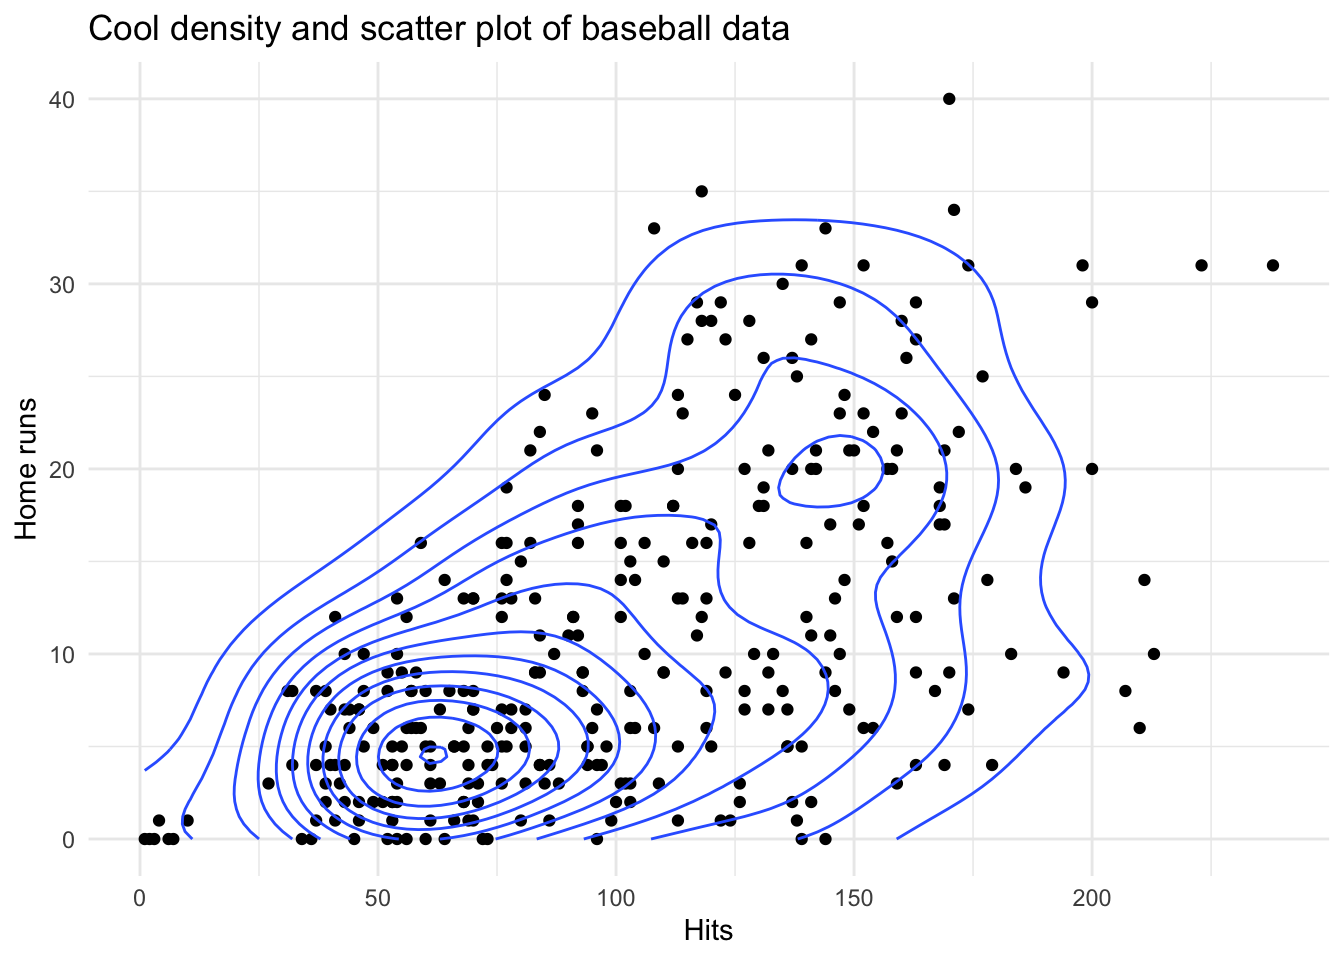
==Name the aesthetics, geoms, scales, and facets of the above visualisation. Also name any statistical transformations or special coordinate systems.
# Aesthetics:
#   number of hits mapped to x-position
#   number of home runs mapped to y-position
# Geoms: points and contour lines
# Scales:
#   x-axis: continuous
#   y-axis: continuous
# Facets: None
# Statistical transformations: None
# Special coordinate system: None (just cartesian)